This tutorial has for goal to introduce how to build a model with GAMA and to use GIS data and graphs. In particular, this tutorial shows how to write a simple GAMA model (the structure of a model, the notion of species…) load gis data, to agentify them and to use a network of polylines to constraint the movement of agents. The pdf of the presentation corresponding to this tutorial is available here. All the files related to this tutorial (shapefiles and models) are available here.
The importation of models is described [here] (https://github.com/gama-platform/gama/wiki/G__ImportingModels)
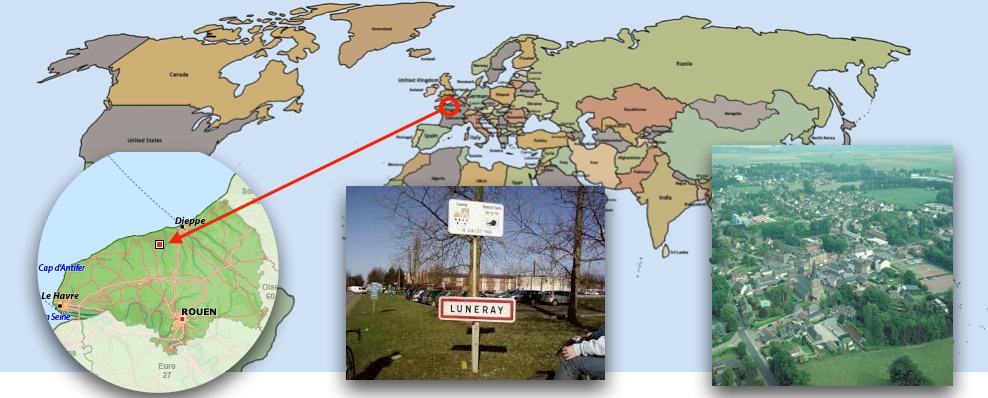
The model built in this tutorial concerns the spreading of a flu in the city of Luneray (Normandie, France).

Two layers of GIS data are used: a road layer (polylines) and a building layer (polygons). In this model, people agents are moving from building to building using the road network. Each infected people can infect the neighbor people.
Some data collected concerning Luneray and the disease:
From the data collected, we made some modeling choice:

This tutorial is composed of 5 steps corresponding to 5 models. For each step we present its purpose, an explicit formulation and the corresponding GAML code.